|
||
|
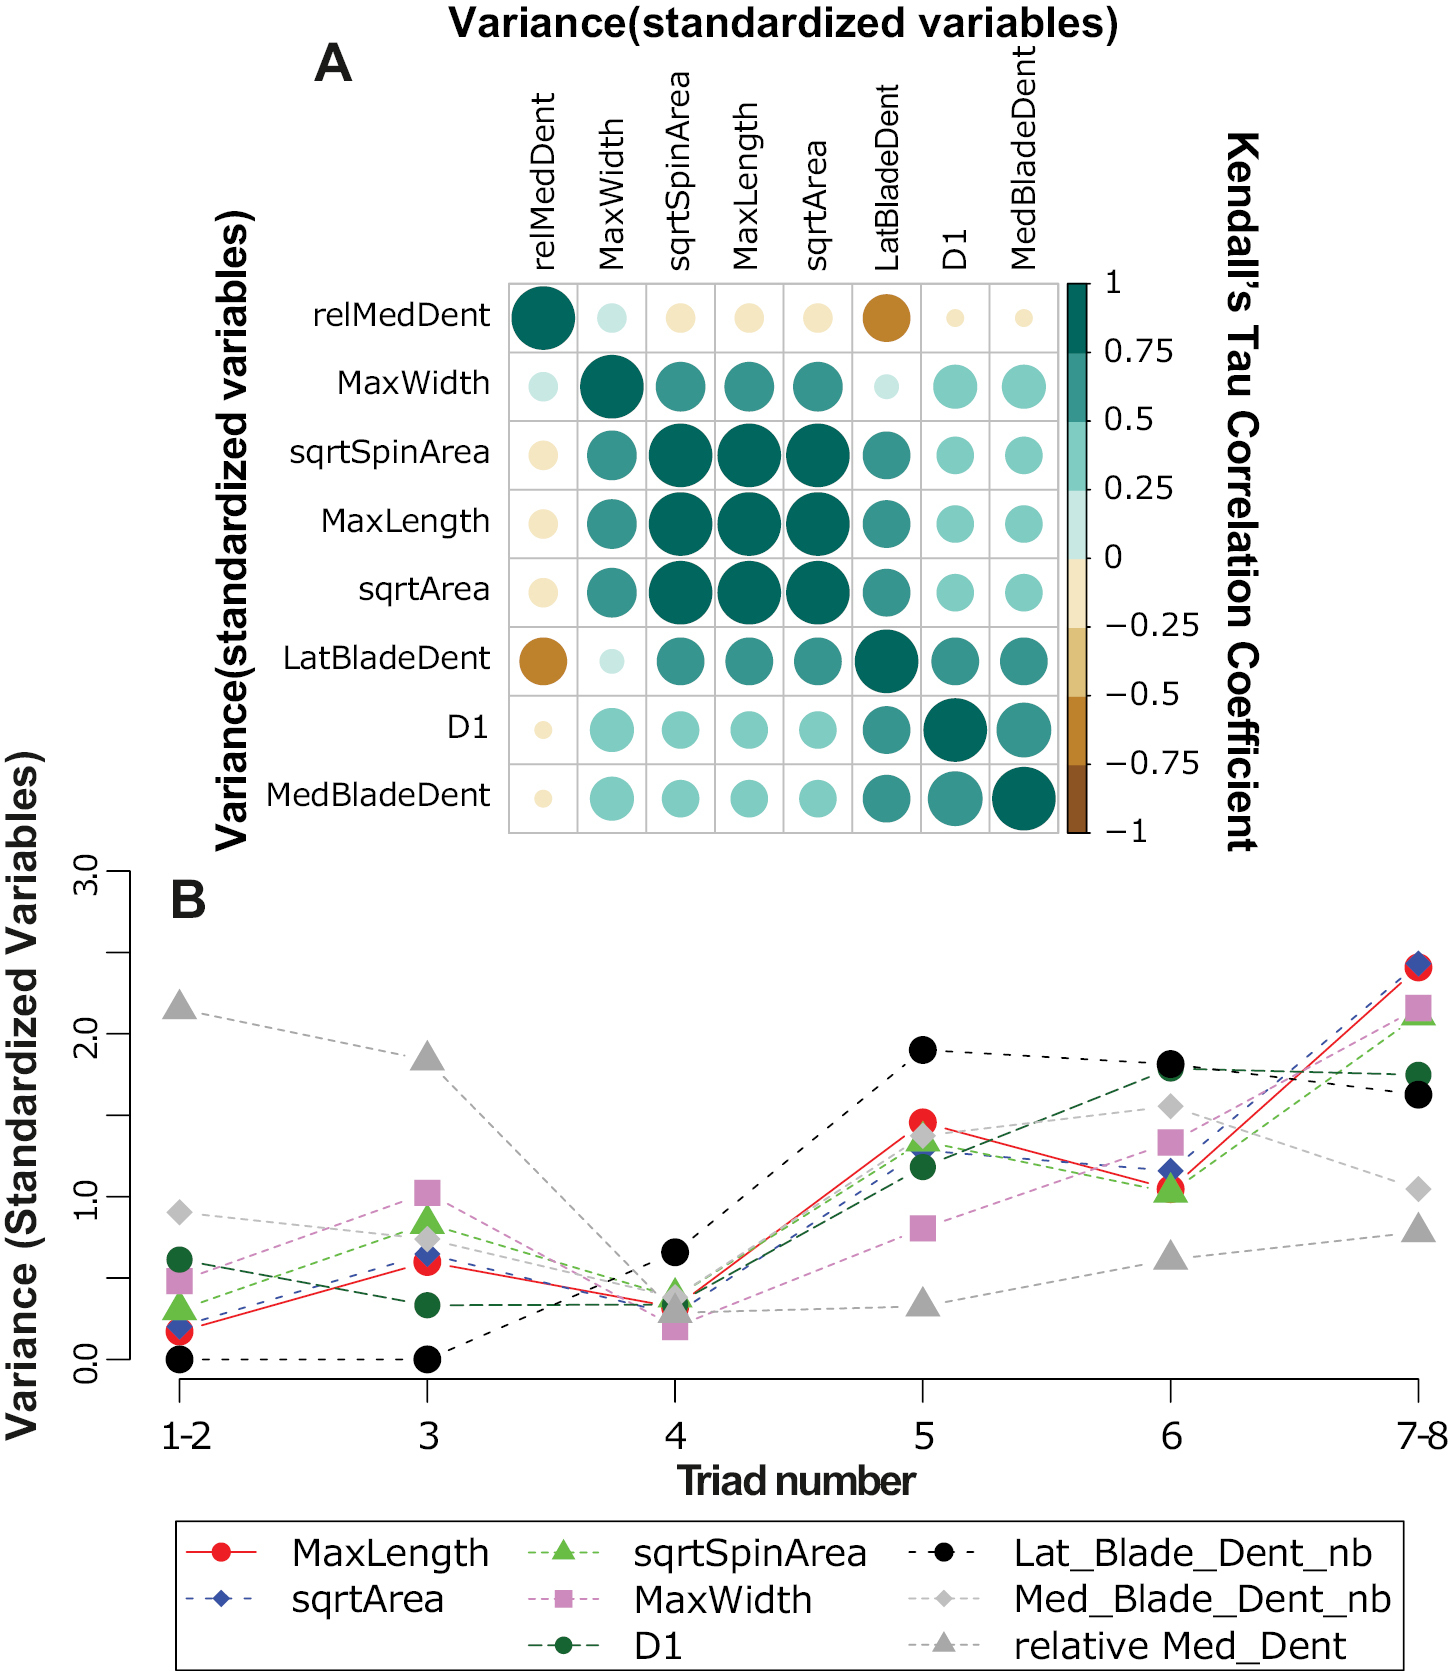
Disparity through ontogeny. The variance of the different reduced-centered variables was estimated for each triad number (triads 1-2 and 7-8 grouped). A. Correlogram showing the congruence of the pattern between variables, estimated using Kendall’s tau coefficient; B. Change in the level of variance through ontogeny. The variance of each variable has been scaled by its mean in order to represent the different lines on a single graph. Variables considered were: MaxLength: maximum length, sqrtArea: √ of the total area of the element; sqrtSpindleArea: √ of the spindle area; MaxWidth: maximum width; D1: distance between the inner and outer denticles of the first triad; LatBladeDent: number of lateral denticles on the blade; MedBladeDent: number of median denticles on the blade; relMedDent: number of median denticles on the spindle, divided by triad number. |